Statistical proof of the Surname’s origin
The page entitled Where and when the surname started showed how the surname’s origin using documentary references was traced to the present day Cheshire manor of Titherington. This was possible because very early references to the family survived in the places they first settled. BUT it is possible that records from other geographic areas could be lost.
However a statistical approach can also be used. If you examine details of a family in a particular village with all records available then one can usually see a family passing through three stages:
1. the arrival of the ‘founder’ , then the births and marriages of his children and grandchildren where the genealogy is easy to connect them altogether.
2. the presence of several families living in the parish with fathers of the same Christian names and where it is not so easy to draw up the family tree with certainty.
3. The presence of perhaps one or two disconnected families that disappear. The disappearance could caused by the family dying out of by individuals moving away.
The various Titterton families can be seen to demonstrate one, two or even all three of these stages.
If a surname has a single point origin then by tracing the ‘founder’ at a new location back to his family at his birth location and so on back you would get to the point origin of the name. This can be done statistically using the ‘median area theory’. This theory tries to place the data about a surname into a mathematical frame work. If a surname has a point origin then over the generations members are going to move away from the origin and set up their own family centres. The spread of the surname will expand with time. If one assumes that there are no social or geographical barriers to prevent or encourage the distribution in any direction from the point source then, by analyzing the data at a particular time, the point source can be calculated.
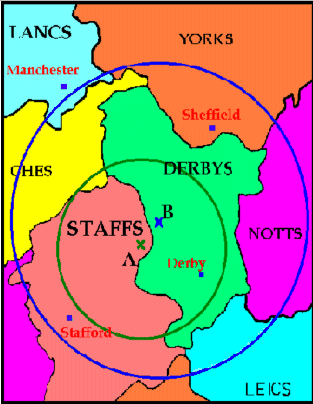
The distribution of a particular set of data is plotted on a map and a circle is drawn which surrounds half the distribution of the name within it and half outside it. The position is this circle is adjusted so that the ratio of half and half is maintained, but the circle’s radius is reduced to a minimum value. The theoretical point origin of the family is the center of the circle with the smallest radius.
This analysis was carried out using the data in the 1988 IGI microfiche (Birth and Marriage collected from UK parish registers by the Mormons) which had an average date of 1801. This is shown by the green circle. This centre is Ellastone, Staffs, 9 miles from Alstonefield. Half of all the then recorded Titterton Births and Marriages were inside this circle.
The distribution of BT telephone subscribers from the 1972/3 telephone directories was also used as a data source. The addresses were plotted on a road map of the UK and the Median Area theory applied. In 1973 ONE HALF of Tittertons in the UK (with telephones) lived inside the blue circle. They were all within 32 miles of Parwich, a Derbyshire village 4 miles from Alstonefield.
The results for both sets of data, shown on the map are in general agreement. This circle is smaller than the telephone directory one because in 1801 the Tittertons had not spread out as far as they had by 1972.

